S-shaped curves have many applications. We will describe how a function called the "logistic function" is used to classify data into two categories, in order to assess, for example, whether a student will successfully complete their studies.
Advertisement
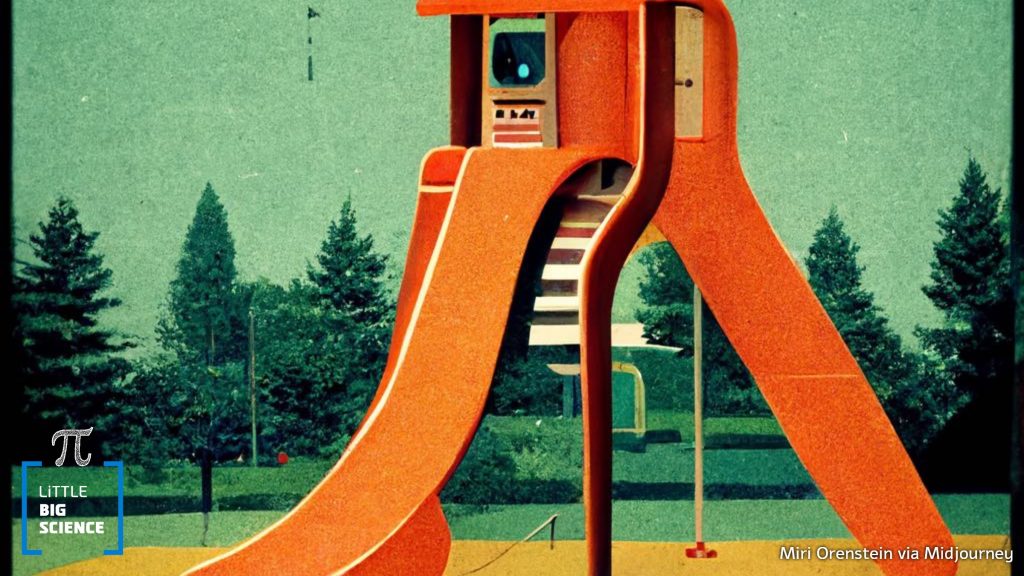
A toddler sat at the top of a tall slide and began to glide. At first the slope was gentle, but it soon became steep and the child sped downward. Farther on, the slope gradually flattened, the speed dropped, and we managed to catch and lift him into the air while he laughed, before his feet touched the ground.
The rounded shape of a slide that starts with a gentle incline, becomes progressively steeper, and then returns to a gentle incline reminded us of a curve that appears in many real-life situations and in science and technology applications. Because it resembles the letter S written on its side, the common name is the “S-curve”, or “sigmoid curve” [1].
One practical use of this function is in computer animation: to make a car’s movement on a screen look realistic, the car must start moving slowly, accelerate smoothly, and finally decelerate smoothly to a stop, all in a way that looks seamless to the viewer.
Many functions describe an S-curve. One of the most prominent is the logistic function [2], which has applications in numerous fields. We will show an example for its use in classification algorithms in machine learning.
Imagine that we are standing between two downspouts on the side of a building. They are dripping: One carries clean water and the other what looks like dirty mop water. Alas, a drop has just landed on our head! We scratch our head and wonder: What is the probability that the drop came from the dirty downspout? This is a binary classification problem, where there is one correct answer out of two—clean water or dirty water. A computer-related example would be whether an uploaded image is identified as a dog or not.
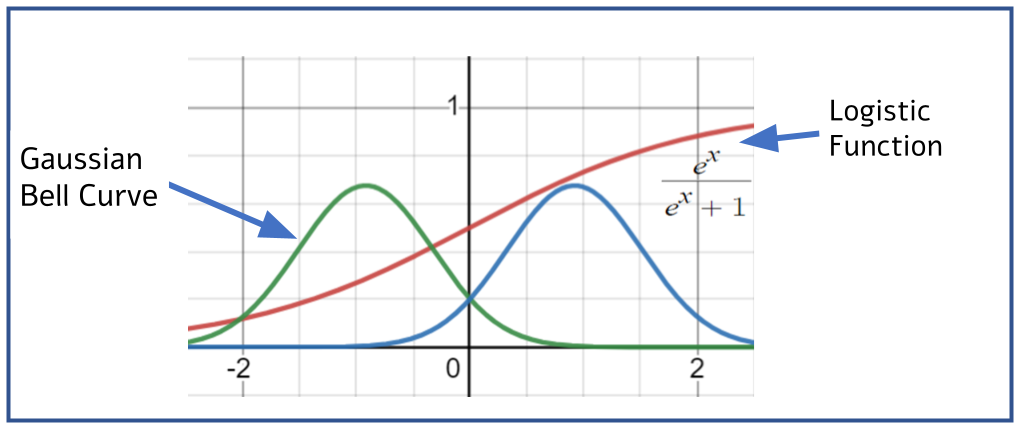
Most drops from a downspout land on the ground near the spout, but there is some spread, and they can splash to the sides. Suppose the distribution of where a drop lands follows a normal distribution. The normal distribution describes many real-world phenomena and can be drawn as a bell curve, called a Gaussian distribution. The probability that a drop will fall at a specific place is represented in the illustration by the height of the bell curve at that point. If we stand directly under the downspout, the probability of being hit is represented by the curve’s height and is maximal. The farther we stand from the spout, the lower the curve’s height, and thus the smaller the chance of being hit.
In our example there are two downspouts, so we draw two bell curves side by side. Note that we may be standing where the chance of being hit by any drop is very small, so the heights of both curves are low at that point. But we are not interested in the probability of being hit; we care about the chance that the drop that hits us comes from the dirty downspout. (For the more math-savvy among you: This is a very hands-on illustration of “conditional probability”.) Therefore, the chance that the drop comes from the dirty-water spout is the height of its curve divided by the sum of the heights of the two curves at that point—that is, the sum of the probabilities of the two possibilities.
Assuming the two downspouts have the same distribution shape, if we stand exactly midway between them, the probability that the drop that hits us is dirty water is 50 percent. If we stand under the clean-water spout, the probability is close to 0, and if we stand under the "bad" spout, the probability is close to 100 percent. What happens in between? Imagine taking small steps along the path between the two spouts. If we are near one of the spouts, the step has almost no effect on the probabilities. By contrast, when we stand midway, even a slight shift greatly changes the value of the probability function: A step toward the bad spout raises the chance that a future drop will be dirty mop water, and a step toward the clean-water spout lowers that chance.
What we obtain is a function that forms an S-curve like the shape of the slide, where the slope (the derivative, in mathematical terms) is low at the ends and maximal at the midpoint—which is probably also the peak of fun when sliding.
Calculating the probability function in our example as a function of position is based on the ratio between variables that are normally distributed. Substituting this into the appropriate equations [3, 4] yields the well-known logistic function equation, which indeed looks like an S-curve.
How can we use this knowledge?
In a study conducted at the University of Arizona, lecturers claimed that, based on the grade in their course, one could predict which students would drop out of their studies. This is a binary classification example, and several methods exist for handling it. Here we present a method that uses the logistic function: Suppose we found that the average grade of students who eventually drop out was x = 65, which is analogous in our story to the position of the downspout (x) dripping mop water; and the average grade of students who complete the degree was x = 80, which is analogous to the location of the clean-water spout. If we look at students with grades between 60 and 70, we see a high dropout rate among them. By analogy: The odds that a drop landing on our head in this zone is dirty mop water are high. The points on the graph approximate the S-curve of the logistic function. To find the best-fitting function for the data, we use a method called “logistic regression” [6]. Once we have the fitted function, we can estimate the future of a particular student by plugging the grade into the equation.
Binary classification is usually employed to make decisions, so a threshold probability must be set above which action is taken. For example: If the probability that a photo of a traveler at the airport matches a wanted person is above 70 percent, we interview them; if a student’s dropout probability is above 80 percent, we offer assistance; and so on.
What about our downspout story? At what threshold probability that the drop on your head is dirty mop water would you run to wash your hair immediately?
Hebrew editing: Galia Halevy Sadeh
English editing: Elee Shimshoni
Image design: Miri Orenstein, using the artificial-intelligence tool Midjourney (the image was generated with the prompt: playground slide robot, 35 mm photography)
References:

Doron is a computer engineer, researcher, and entrepreneur in the field of mathematical education.


